JSXGraph and 3D graphics
Juha-Matti HuuskoUniversity of Eastern Finland
juha-matti.huusko@uef.fi
As the talk may be contain many technicalities, the intended audience are university teachers and developers.
In general, how can 3D graphics be added in a down-to-earth fashion? How to do it efficiently? Could JSXGraph some day handle 3D points natively?
Let us use JSXGraph to visualize 3D objects: points, lines, planes, solids and surfaces. To rotate the object, we add sliders for the Azimuth (az) and Elevation (el).
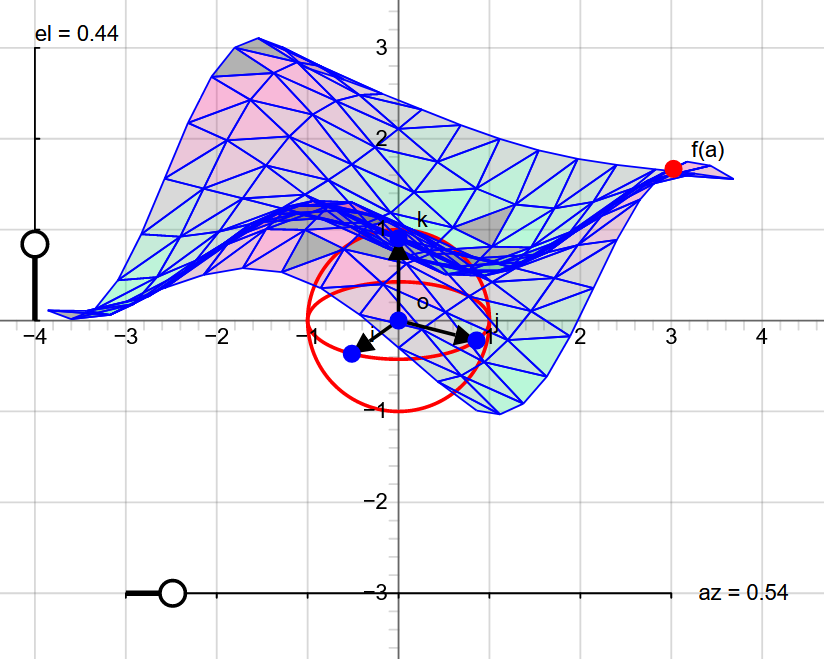
First, let us consider the surface \(z=f(x,y)\).
The user can give a formula of \(f(x,y)\). We can then calculate \(z_{jk}=f(x_j,y_k)\) for each rectangular lattice point \((x_j,y_k)\) in \([-L,L]^2\).
The points \(p_{jk}=(x_j,y_k,z_{jk})\) can be projected to a plane and visualized in the computer. The triangles \(p_{jk}, p_{j(k\pm 1)}, p_{j(k\pm 1)}\) can be drawn to produce a surface. For rotations of the surface, the example code uses rotation matrices.
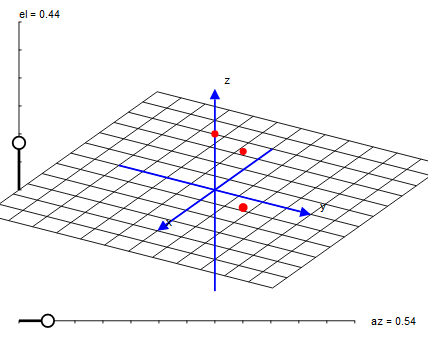
Second, let us consider the geometric objects.
JSXGraph supports generic projective mappings which allow us to slant the \(xy\) plane. When we add the \(z\) axis, we obtain a visualization of \(\mathbb{R}^3\).
A rectangular grid in the \(xy\) plane becomes a slant grid. A magnetized point \(p_{xy}=(x,y,0)\) snaps to the slant grid and moves as the Azimuth is adjusted. A magnetized point \(p_z=(0,0,z)\) can be moved on the \(z\) axis. The 3D point \(p=p_{xy}+p_z\) can be adjusted easily with the mouse.
To handle the code by pressing buttons, a JSXGraph editor was coded in PHP.
Links which were used
- http://integraali.com/vektorit-ja-matriisit/jsxgraph/kuvat/3d/cube.html
- http://integraali.com/vektorit-ja-matriisit/jsxgraph/kuvat/3d/tetraedri.html
- http://integraali.com/sample/havainnollistus/7-kappale3-kuutio.html
- http://integraali.com/sample/havainnollistus/8-pinta-piirturi3.html
- http://integraali.com/jsxgraph/JSXeditor10.php
- http://integraali.com/umd2021/havainnollistus/jsxgraph-tausta-uusi2.html
- http://integraali.com/vektorit-ja-matriisit/jsxgraph/kuvat/3d/distance.html
- http://integraali.com/vektorit-ja-matriisit/jsxgraph/hakemisto.php
- http://integraali.com/sample/havainnollistus/kompleksioma/kompleksioma.php?tiedosto=kisu.jpg
- http://integraali.com/sample/havainnollistus/kuvaus-pallo7.php
- http://integraali.com/sample/havainnollistus/projective-transformation-map-and-aerial.html
- http://integraali.com/umd2021/hakemisto.php
- http://integraali.com/umd2021/havainnollistus/difyht-turtle6.html